Master of IT in Business · SMU · Singapore
Data analytics and business intelligence
Thant Thu Aung, Teddy
I’m a Master of IT in Business student at SMU, specialising in data science and analytics. I clean and model data, check that the results hold up, and build the tools people use to act on them: a contract dashboard in Power BI and Microsoft Fabric in my internship, machine-learning and statistical analyses at JCU, and an Android app I built on my own.
Open to data & analytics internshipsthantthua.2026@mitb.smu.edu.sg
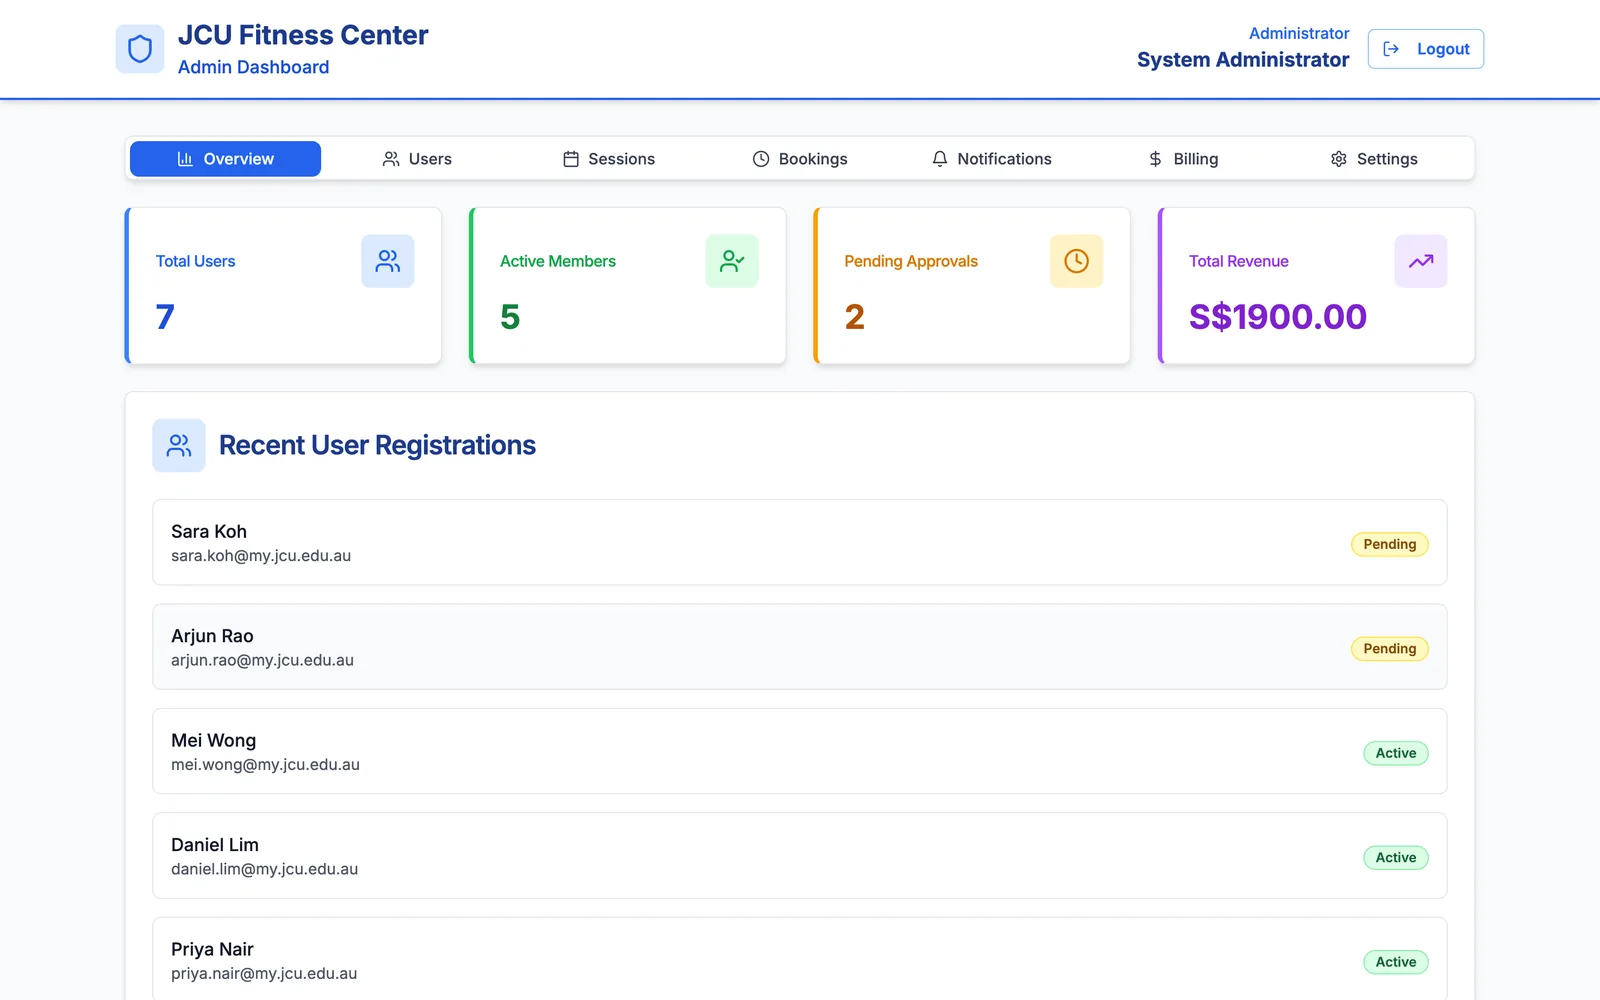
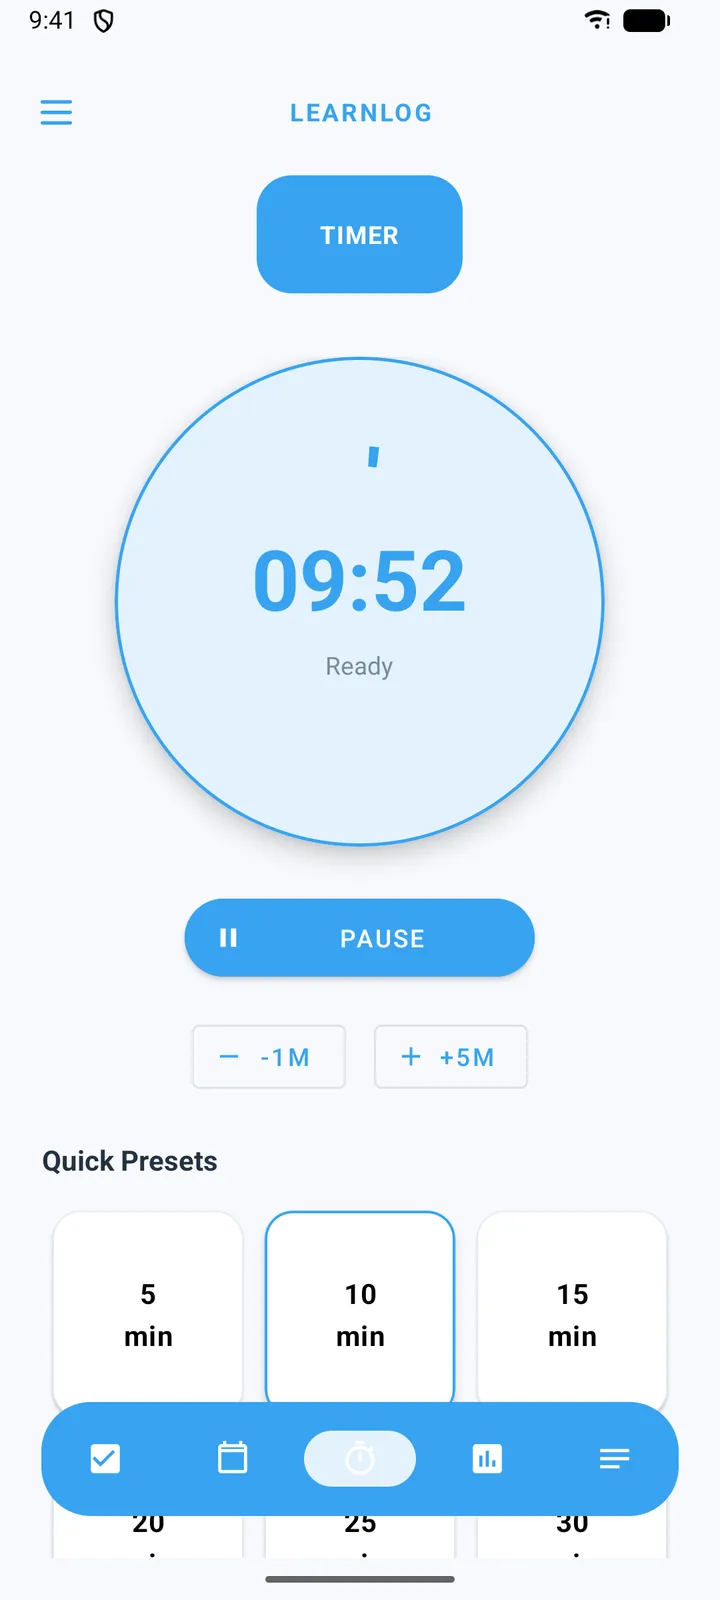
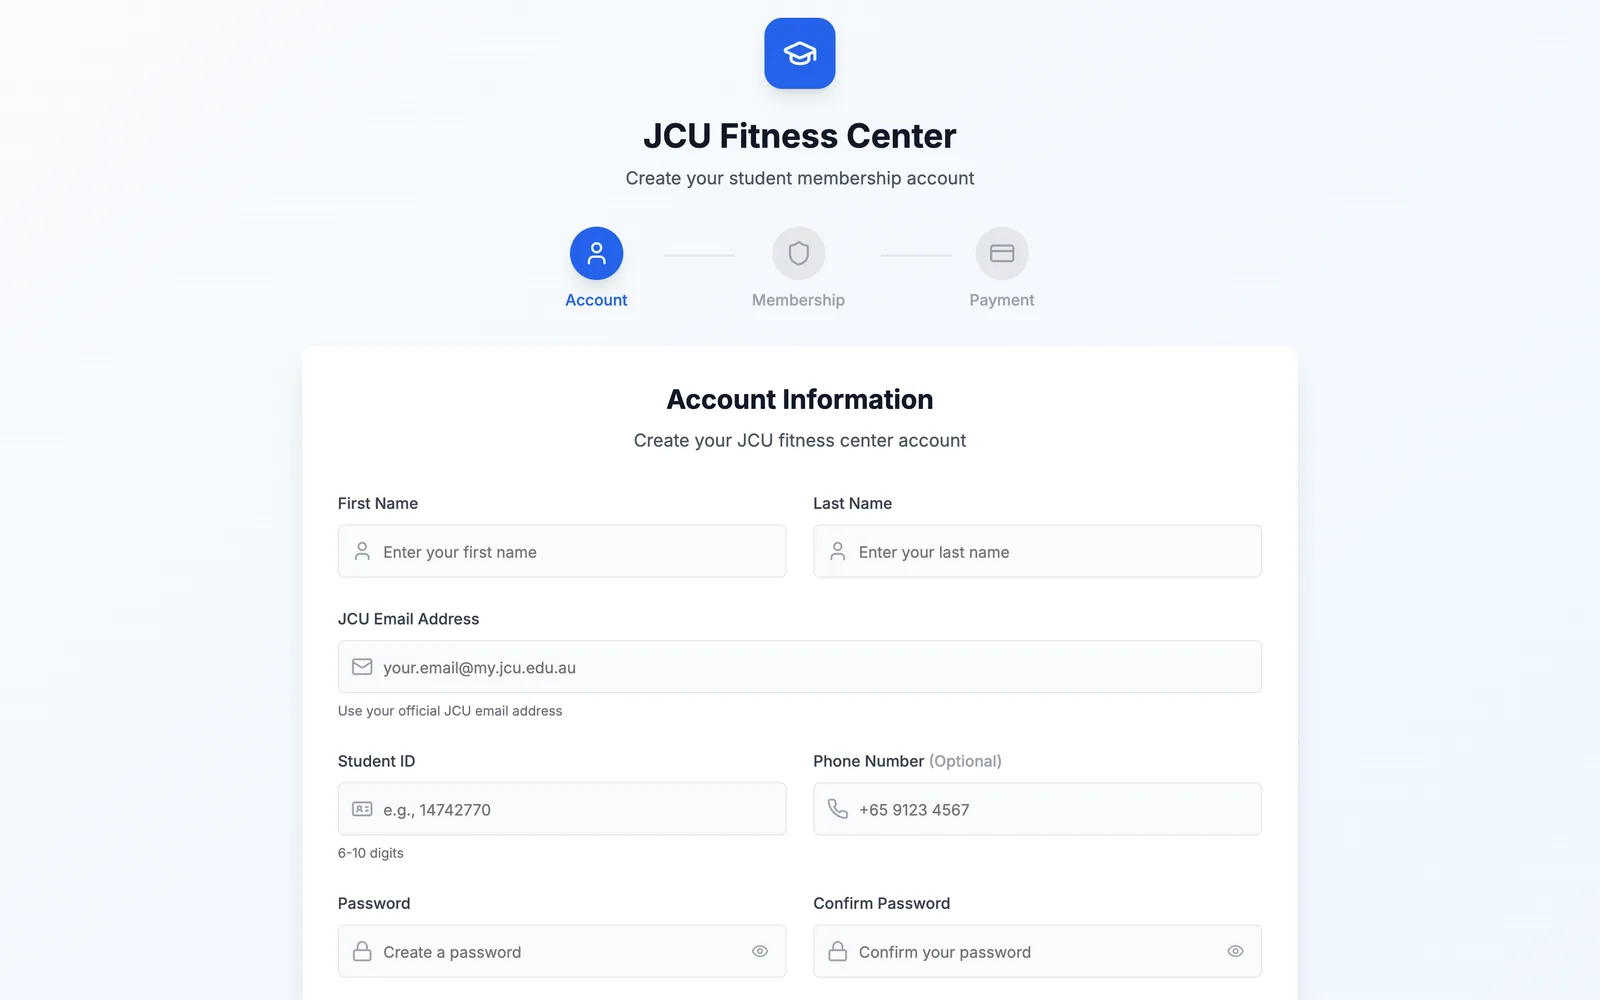
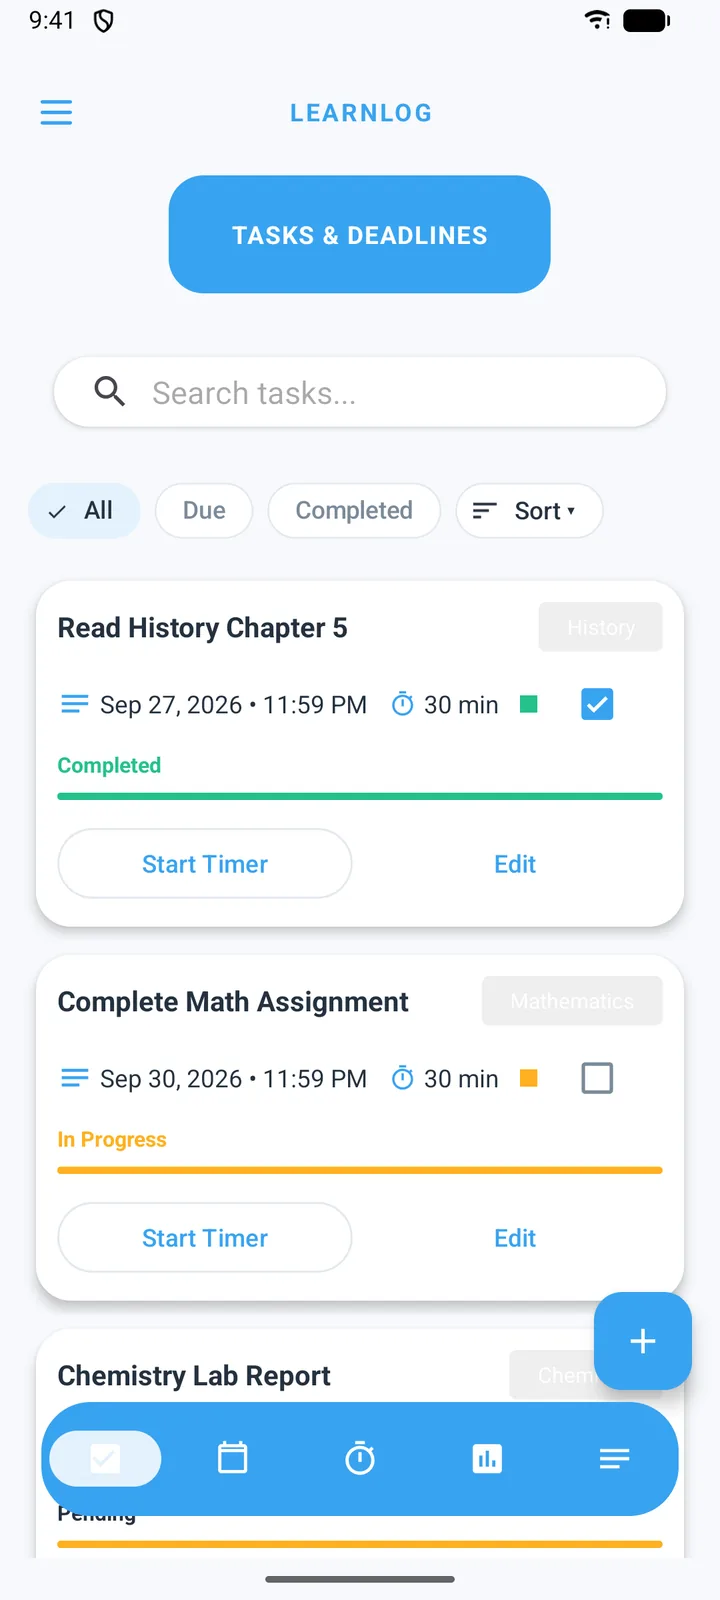
From my work: the internship dashboard (as a layout sketch, no company data), the gym booking app, an ocean-data model and LearnLog.
Highlights
- 13 weeksas a remote data analytics intern, building a contract dashboard in Power BI and Microsoft Fabric with DAXInternship
- 280,000+business registration records behind a hub-ranking model (sampled to 28,000 for modelling)Growth hubs
- 0.959R² for the dissolved-oxygen model I chose from three candidates on AIC and residual checks, not R² aloneOcean statistics
- 2 sprintsrun as Scrum coordinator for a two-person web app: 8 user stories, 53 person-days, burndown and velocity chartsGym project
Selected work
One internship, two data projects, two software builds.
Each case study covers the question, my part in it, the decisions that mattered, the evidence, and what I would change.
01Internship · BI & reporting
Contract Intelligence Dashboard
Worldtech Electronic Co., Ltd. · Remote · 2026
A two-page Power BI report on Microsoft Fabric for monitoring a contract portfolio: what is active, what expires soon, and where the contracted value sits.
- My part
- Built both report pages, wrote the DAX measures and expiry logic the model was missing, and redesigned the layout after supervisor review.
- Result
- 2-page report tracking active contracts, the expiry pipeline and contracted value, with the DAX expiry logic the data model was missing.
- Power BI
- Microsoft Fabric
- DAX
- Azure Storage
02Machine learning
Singapore Growth Hubs
Team project · CP3403 Data Mining, JCU · 2025
Which parts of Singapore look most likely to become business hubs? We used business registration records to classify, rank and cluster locations.
- My part
- Feature engineering and model development across the classification and clustering stages.
- Result
- Ranked shortlist scored by model confidence weighted by business count, so a handful of firms can’t outrank hundreds. Paya Lebar, Anson and Robinson Roads led, and both classifiers agreed on the top four.
- Python
- pandas
- scikit-learn
- kmodes
- Matplotlib
03Statistical analysis
Ocean Water Statistics
Individual coursework · CP2403, JCU · 2025
Four questions about ocean water quality, each answered with the method that fits the data: ANOVA, chi-squared, simple and multiple regression.
- My part
- Everything: data preparation, method choice, modelling, diagnostics and the written reports.
- Result
- R² = 0.959 for dissolved oxygen, from the model I chose out of three candidates on AIC and residual checks, not on R² alone.
- Python
- pandas
- statsmodels
- SciPy
- seaborn
04Agile delivery · web app
JCU Gym Management System
Team of 2 · Advanced Software Engineering, JCU · 2025
A gym booking system built in two Scrum iterations: members register and book sessions; admins approve accounts, manage sessions and track usage and billing.
- My part
- I ran our Scrum process (planning, task allocation, the project board, burndown and velocity charts) and led the documentation. My teammate wrote most of the code.
- Result
- 53 person-days logged and tracked over two sprints (51 were planned), delivering a working Next.js and PostgreSQL app with member and admin consoles.
- Scrum
- User stories
- GitHub Projects
- Burndown & velocity charts
- Technical writing
05Android app
LearnLog
Solo academic project · 2025
A study app that keeps tasks, planned sessions and actual focus time in one place, so students can compare what they planned with what they did.
- My part
- Designed, built and tested the whole app on my own: 28 commits over seven weeks.
- Result
- Five modules (Tasks, Planner, Timer, Insights and Notes), with tasks, focus sessions and notes stored locally and a focus timer that keeps running in the background.
- Kotlin
- MVVM
- Hilt
- Room
- WorkManager
- Firebase Auth

Inside a project · Singapore Growth Hubs
From 280,000 records to a ranked shortlist.
Define what “hub” means
There’s no column for “future business hub”, so the first decision is the target. We tried two proxies: how busy a location already is, and how quickly new businesses are arriving.
SVM · density proxyhub = registrations in region > median
Balanced classes; measures how busy a place already is.Random Forest · growth proxyhub = latest-year new registrations ≥ 90th percentile
Targets places where new businesses are arriving fastest.Get the data into shape
More than 280,000 registration records, sampled to 28,000 for fast iteration. Dates and numbers were coerced and checked, incomplete rows dropped, and each location keyed by postal code and street name.
- 280,000+Business registration recordsLocation, entity type, status and industry code
- 28,00010% random sampleFixed seed, for faster iteration
- CleanedIncomplete rows removedInvalid dates and numbers coerced to missing; the block column alone had 360 gaps
- RegionsPostal code + street nameThe unit that is labelled, scored and clustered
Model, then check the model
An SVM baseline reached about 79% accuracy, and a Random Forest that also used business type and industry reached about 91%. The two used different labels, and location features let the forest partly memorise each region, so I treat 91% as an upper bound.
Cross-validated accuracy
- SVM~79%Density label (above-median registrations). Folds: 80.2%, 79.9%, 77.6%.
- Random Forest~91%Growth label (top 10% of latest-year registrations). Mean of 3 stratified folds.
Different labels, so not a like-for-like comparison.
Random Forest · holdout (6,192 records)
Random Forest confusion matrix on the holdout set: rows are actual classes, columns are predicted classes. Predicted non-hub Predicted hub Actual non-hub 3,476True non-hub 277False hub Actual hub 395Missed hub 2,044True hub - Non-hub
- precision 0.90 · recall 0.93 · F1 0.91
- Hub
- precision 0.88 · recall 0.84 · F1 0.86
Turn predictions into a shortlist
Probabilities become a ranking weighted by how many businesses back them up, so a location with three firms can’t outrank one with nine hundred. Paya Lebar Road, Anson Road and Robinson Road came out on top.
score = p̄(hub) × log(1 + businesses)
- A region with 3 businessesHypothetical, for comparison · p̄ = 0.990score 1.37
- Paya Lebar Road995 businesses, ranked first · p̄ = 0.989score 6.83
Near-identical confidence, five times the score: volume decides.
- Read the full case study
01 · Target definitions
hub = registrations in region > median
Balanced classes; measures how busy a place already is.hub = latest-year new registrations ≥ 90th percentile
Targets places where new businesses are arriving fastest.Experience & education
Where I’ve done the work.
- WorkJan – Apr 2026 · 13 weeks
Data Analytics Intern
Worldtech Electronic Co., Ltd. · Thailand · Remote
- Built a two-page Power BI report on Microsoft Fabric for a contract-intelligence project: a Contract Log (KPI cards, filters, full contract table) and a Contract Analytics page (top markets, expiry pipeline, contracted revenue).
- Worked on the DAX measures and expiry logic the data model was missing, so expiring-contract figures and the analytics summaries came out accurate.
- Mapped the data model (contract details to contract rates) and the Azure storage flow (raw, processed, archive) to see what the report could support.
- Reworked the first draft after supervisor review so it followed the company design guide and was easier to scan: corrected the header, improved the KPI layout and filter section, and cleaned up the table’s field names.
- EducationAug 2026 – Dec 2027 (expected)
Master of IT in Business · Data Science & Analytics track
Singapore Management University · Singapore
- Current modules: Statistical Thinking for Data Science, Query Processing and Optimisation, Data Analytics Lab, Computational Thinking with Python.
- EducationFeb 2024 – Apr 2026
Bachelor of Information Technology
James Cook University · Singapore
- Awarded a 25% merit scholarship.
- Academic projects in data mining, statistical analysis, software engineering, Android development and design thinking. Four are written up on this site.
- Leadership
Secretary & Head of Public Relations
JCU Myanmar Student Community · Singapore
- Organised club activities, managed communications and created promotional content.
Skills, and where I’ve used them
Every group links to the project or role that shows it.
| Area | Tools and methods | Evidence |
|---|---|---|
| Statistics & analysis | Python, pandas, statsmodels, SciPy, seaborn | |
| Machine learning | scikit-learn, SVM, Random Forest, K-Prototypes, PCA | |
| BI & reporting | Power BI, Microsoft Fabric, DAX, Power Query, Azure Storage | |
| Databases & data models | SQL, Room (SQLite), Schema design, Data modelling | |
| Mobile engineering | Kotlin, Android, MVVM, Hilt, WorkManager | |
| Delivery & communication | Scrum, Sprint planning, User stories, Technical writing, Figma |
Also on my résumé: PostgreSQL, React, Java, C++ (basic), Git, Jupyter. Languages: English and Burmese.
Design practice
Prototyping for real users.
Design Thinking coursework at JCU: team design sprints that went from a user problem to a clickable prototype. Each link opens the original Figma or Miro file.
- Mobile app prototypeCultilinkHelps international students settle into campus life: events, a virtual campus tour, a video library and a peer forum.View in Figma (opens in a new tab)
- Web app prototypeContent verification systemUpload text, images or video, see matched segments with scores, and get suggested fixes with before-and-after comparison.View in Figma (opens in a new tab)
- Mobile app conceptElderCare KioskAppointment booking, home check-ups, medical vouchers and donations, designed around elderly patients.View in Miro (opens in a new tab)
- Website prototypeConfidence-building workshopsProgramme pages, session breakdowns, registration and participant feedback for a communication-skills workshop.View in Figma (opens in a new tab)
- Mobile app UI prototypeAupiEnd-to-end flows for search, messaging, maps, friends and subscriptions, with consistent components throughout.View in Figma (opens in a new tab)
About
Hi, I’m Thant Thu Aung (Teddy).
My first degree was in IT, at James Cook University in Singapore, where I took data mining and statistics alongside software engineering. A data analytics internship, building a contract dashboard in Power BI, strengthened my interest in data. Now at Singapore Management University (SMU), I’m specialising in data science and analytics.
I like work where the numbers have to hold up. In my regression work I chose between models on AIC and residual behaviour rather than stopping at R², and my growth-hubs write-up is explicit about what our label did and didn’t measure.
On teams I tend to take on coordination and writing as well as code. I ran our Scrum board and led documentation on the gym system, and at JCU I was Secretary and Head of Public Relations for the Myanmar Student Community, organising events and creating promotional content.
- Based in
- Singapore
- Studying
- Master of IT in Business, SMU (to Dec 2027)
- Looking for
- Data analyst, BI and data science internships
- Languages
- English, Burmese
Contact
Let’s connect.
Whether it’s a role, a project or a question about my work, email is the fastest way to reach me. I’m happy to walk through anything on this site.