Statistical analysis · Individual coursework · CP2403, JCU · 2025
Four questions about ocean water, four statistical tests
Solo coursework on a large oceanographic dataset: choosing the right test for each question, checking its assumptions, and being clear about what the numbers do and don’t show.
Dissolved oxygen: predicted vs measuredModel B · 331 samples · R² = 0.959
Each dot is a water sample; the red line is where prediction equals measurement.
01 Overview
One dataset, four methods
CP2403 asked for four analyses on one real dataset, each using a different statistical method. I worked with an oceanographic bottle-sample dataset (bottle.csv) that records depth, temperature, salinity, dissolved oxygen, nitrate and chlorophyll-a for water samples.
02 Questions
Matching each question to a method
| Question | Method | Why this method |
|---|---|---|
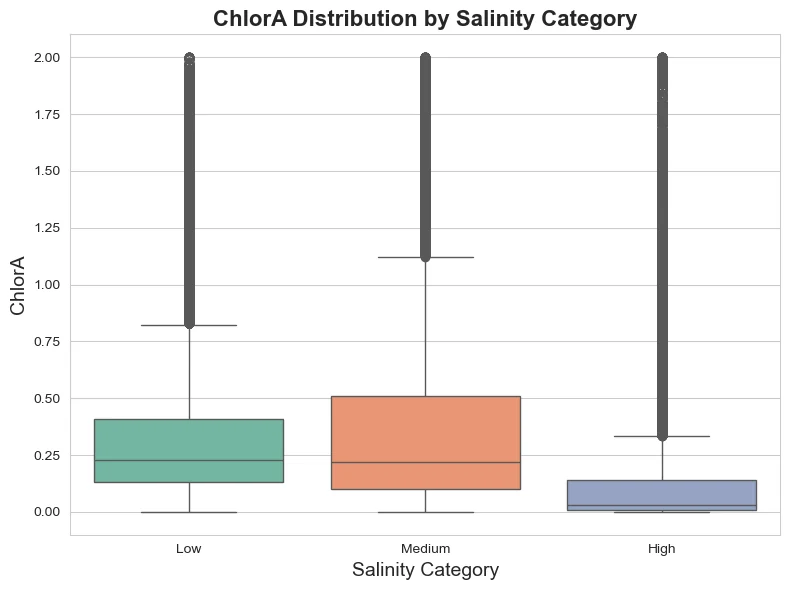
| Does chlorophyll-a differ between low, medium and high salinity? | One-way ANOVA, then Tukey HSD | Compares means across three groups, then identifies which pairs differ |
| Are oxygen level and nitrate level related? | Chi-squared test of independence, then standardised residuals | Both variables are categories |
| How does temperature change with depth? | Simple linear regression | One continuous predictor, one continuous response |
| What best predicts dissolved oxygen? | Multiple regression, three candidate models | Several correlated predictors, and the right model form had to be chosen |
03 My role
Scope
This was individual work. I cleaned the data, chose the methods, fitted the models, ran the diagnostics and wrote a report for each task. Every task has its own notebook and PDF report in the repository.
04 Approach
Decisions worth explaining
Limit each model to a range I could defend
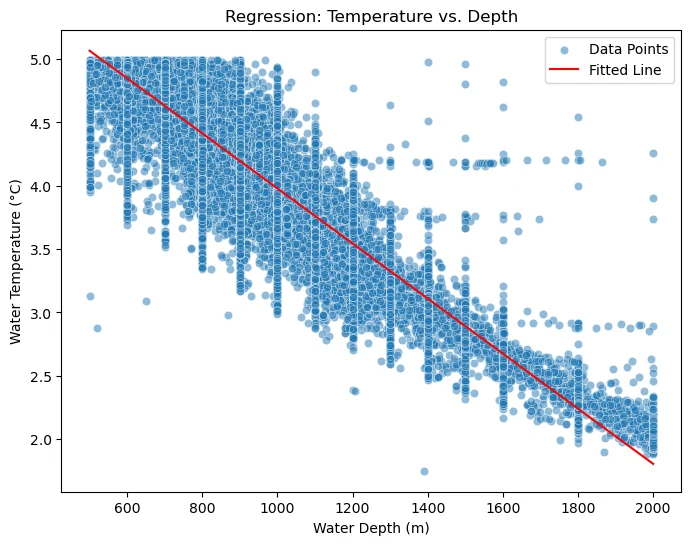
For temperature vs depth I kept samples between 500 and 2,000 m with temperatures between 0 and 5 °C (47,631 rows). The model is honest about where it applies and says nothing about the warm surface layer.
Build categories from quantiles
Salinity, oxygen and nitrate were split into equal-sized thirds, so every category had plenty of observations and none dominated the tests.
Centre predictors before adding squared terms
Centring makes the intercept meaningful and reduces the collinearity between a variable and its own square.
Choose a model on more than R²
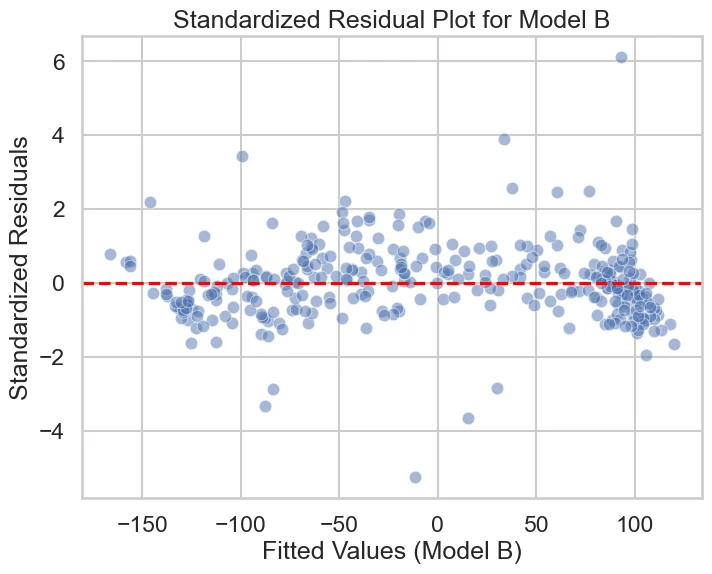
Two candidate models fit almost equally well, so AIC, residual patterns and Q-Q plots decided between them.
05 Analysis
The four analyses
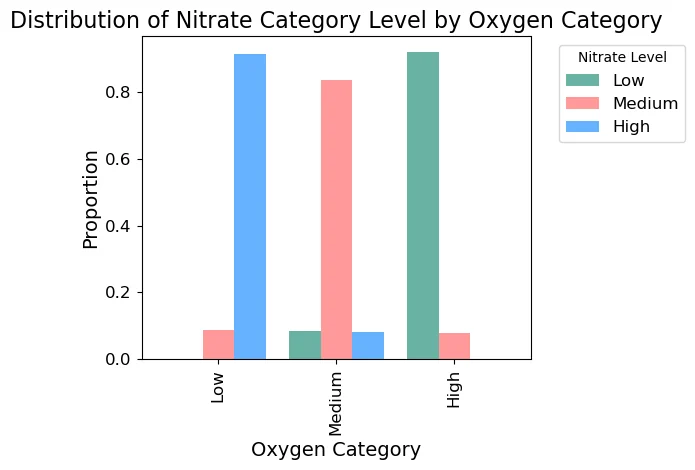
For the chi-squared test I didn’t stop at the p-value. Standardised residuals, with a Bonferroni-corrected threshold of 0.05 / 9 ≈ 0.0056, showed where the association comes from: low oxygen with high nitrate was observed 102,251 times against 37,080 expected, and high oxygen with high nitrate only 6 times against 36,982 expected.
The linear regression gives T = 6.1538 − 0.0022 × depth: within 500–2,000 m, water is about 0.22 °C colder for every additional 100 m, and depth explains 81.7% of the variation in temperature.
| Oxygen | Depth | Salinity | Nitrate | |
|---|---|---|---|---|
| Oxygen | 1.00 | −0.42 | −0.87 | −0.97 |
| Depth | −0.42 | 1.00 | 0.51 | 0.50 |
| Salinity | −0.87 | 0.51 | 1.00 | 0.85 |
| Nitrate | −0.97 | 0.50 | 0.85 | 1.00 |
negative positiveStronger colour, stronger correlation.
| Model | Predictors | R² | Adj. R² | AIC | Residuals beyond ±2 SD | Verdict |
|---|---|---|---|---|---|---|
| A | Depth + Salinity + Nitrate | 0.958 | 0.958 | 2,840 | ~4.5% | Acceptable |
| B | Depth² + Salinity + Nitrate | 0.959 | 0.958 | 2,835 | ~3.6% | Chosen |
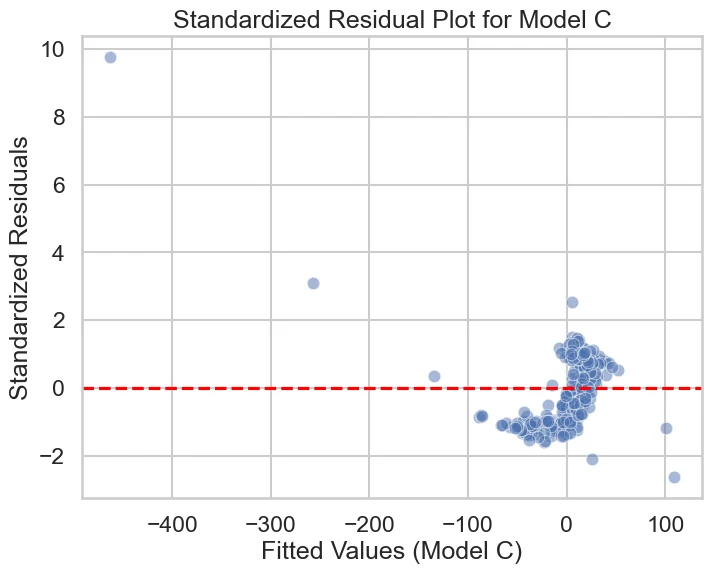
| C | Depth + Salinity² + Nitrate² | 0.201 | 0.194 | 3,816 | ~7.8% | Rejected |
06 Findings
What the data says
- R², temperature explained by depth (500–2,000 m)
- 0.817
- R², dissolved oxygen, Model B (adjusted 0.958)
- 0.959
- salinity groups that differ pairwise in chlorophyll-a
- 3 / 3
- correlation between nitrate and dissolved oxygen
- −0.97
- Salinity matters for chlorophyll-a: high-salinity water had the lowest mean (≈ 0.15, against ≈ 0.32 for low and ≈ 0.37 for medium).
- Oxygen and nitrate move in opposite directions: the association is driven by low-oxygen/high-nitrate and high-oxygen/low-nitrate water.
- Between 500 and 2,000 m, temperature falls almost linearly with depth.
- For dissolved oxygen, I chose Model B (squared depth + salinity + nitrate). It matched Model A’s fit, had a lower AIC (2,835 vs 2,840) and fewer residuals beyond ±2 SD (3.6% vs 4.5%). The squared term reflects oxygen dropping quickly with depth and then levelling off.
07 Limitations & learning
Caveats I’d flag to anyone using these results
- With huge samples, “significant” is easy. At 189,471 observations almost any difference produces a tiny p-value; the size of the difference is what matters.
- Samples aren’t independent. Residuals in the depth model are strongly autocorrelated (Durbin–Watson 0.33), as expected when measurements come from the same casts, so the standard errors are optimistic.
- Model B’s edge over Model A is small. I chose B for its residual behaviour, but A would also be a reasonable choice.
- Correlated predictors blur individual effects. With salinity and nitrate at r = 0.85, their separate coefficients shouldn’t be read as independent effects.
- Most of the fit comes from nitrate. A check I ran afterwards: nitrate alone gives R² = 0.945. Squared depth and salinity lift that to 0.959, a small gain in R², but they explain about a quarter of the variation nitrate leaves and cut AIC from 2,928 to 2,835.
- Task 4 used a 0.1% random sample (331 observations). Refitting on more data would firm up the comparison.
08 Links